

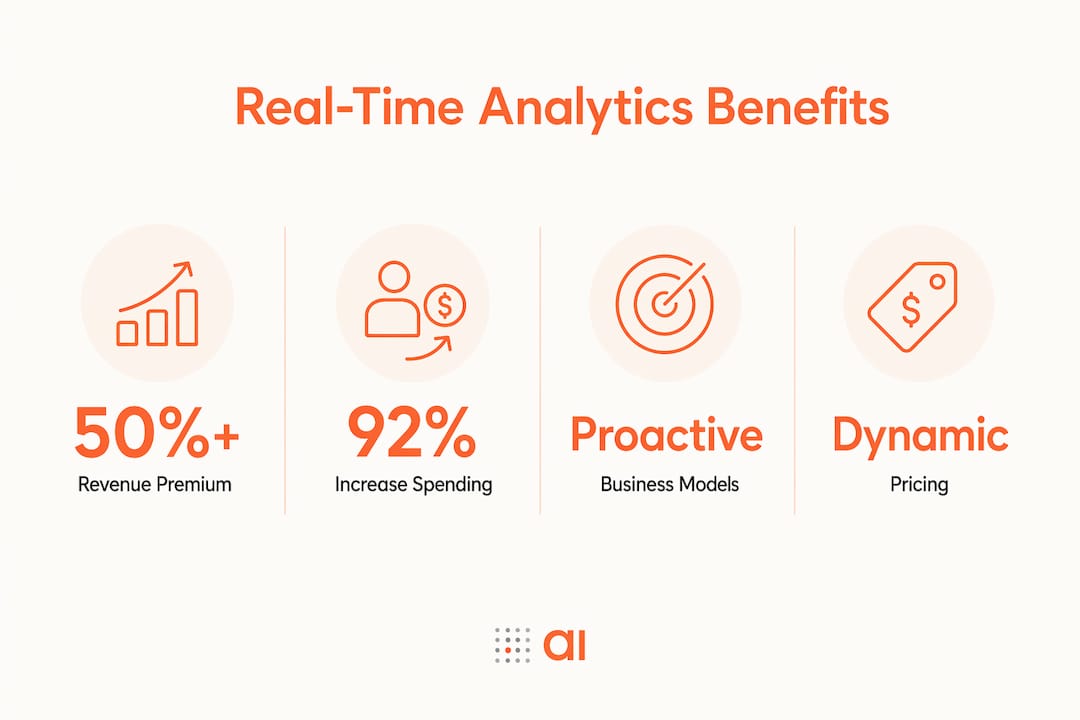
Real-time data views are defined as continuously updated representations of business data with latency ranging from sub-second to under one minute, giving analysts and leaders the ability to act on what is happening now rather than what happened yesterday. Companies in the top quartile of real-time capability achieve more than 50% higher revenue growth and net margins than their peers. That gap is not a coincidence. It reflects the compounding advantage of faster decisions, earlier problem detection, and tighter operational control. This article covers the technical foundations, business benefits, organizational requirements, and practical deployment of real-time data views so you can move from understanding to action.
Why real-time data views matter: the core case
The industry term for what most people call "real-time data views" is real-time analytics, and the distinction between that and traditional batch reporting is not just technical. It is strategic. Batch processing collects data over a period, typically hours or overnight, then loads it into a warehouse for analysis. Real-time analytics, by contrast, processes data as it arrives using streaming architectures and event-driven pipelines. The result is a dashboard or application that reflects the current state of your business, not a snapshot from last night.
Apache Kafka is the industry standard for high-throughput, sub-second latency event streaming, ingesting millions of events per second to power real-time pipelines. Tools like Microsoft Power BI, Grafana, and Gainable sit on top of those pipelines to surface live views that teams can actually use. Near real-time processing, which operates at one to five minute latency, covers most business use cases at lower infrastructure cost. True sub-second latency is reserved for fraud detection, algorithmic trading, and similar high-stakes scenarios.

The table below clarifies the three main architectures so you can match the right approach to your decision velocity requirements.
| Architecture | Typical latency | Best for |
|---|---|---|
| Batch processing | Hours to days | Monthly reporting, historical analysis |
| Near real-time | 1 to 5 minutes | Operational dashboards, inventory alerts |
| Streaming (real-time) | Sub-second to seconds | Fraud detection, dynamic pricing, IoT monitoring |
Pro Tip: Match your data freshness target to your actual decision latency. If your team reviews dashboards every 30 minutes, near real-time processing delivers the same business value as sub-second streaming at a fraction of the cost.
What the performance data actually says
The 50% revenue and margin premium reported by MIT Sloan is the most cited figure in real-time analytics research, and it deserves unpacking. It does not mean that installing a streaming pipeline automatically lifts revenue. It means that organizations with mature real-time capabilities, meaning the technology, the processes, and the empowered people to act on live data, consistently outperform those without. The performance gap compounds over time because faster feedback loops produce better decisions at every level of the business.
The investment signal confirms the direction of travel. 92% of business leaders plan to increase spending on real-time data analytics, which means competitive pressure to adopt these capabilities will only intensify. If your competitors are moving to live operational views and you are still running nightly batch reports, you are making decisions with older information on every cycle.
Real-time analytics shifts business models from reactive to proactive by enabling dynamic pricing, fraud prevention, and revenue protection at a speed that batch processing cannot match. A retailer using live pricing data can respond to a competitor's promotion within minutes. A financial services firm using streaming transaction data can block a fraudulent card before the customer leaves the checkout. These are not incremental improvements. They are category differences in operational capability.
| Industry | Real-time use case | Business impact |
|---|---|---|
| E-commerce | Live inventory and pricing dashboards | Prevents stockouts, enables dynamic pricing |
| Financial services | Streaming transaction monitoring | Millisecond fraud detection and blocking |
| Manufacturing | IoT sensor data streaming | Predictive maintenance, reduced downtime |
| Operations | Live customer service dashboards | Faster escalation and resolution |
Pro Tip: Start your business case for real-time analytics with a single use case where the cost of delayed decisions is quantifiable. Fraud losses, stockout revenue, and unplanned downtime are all measurable. That number becomes your ROI anchor.
Does technology alone make real-time data work?
No. Real-time capability depends on organizational empowerment and decentralized decision-making as much as it depends on technology. MIT Sloan describes this as "real-time-ness," a combination of digitized operations, empowered employees, and governance guardrails that together allow the organization to act on live signals without waiting for hierarchical approval.
The failure mode is common and frustrating. A team installs a live dashboard, data flows in at sub-second latency, and then every alert still requires three levels of sign-off before anyone acts. The technology delivered real-time data. The organization delivered batch-speed decisions. The performance premium never materialized.
To avoid that trap, consider these organizational prerequisites before investing in streaming infrastructure:
- Decision rights are clear. Frontline teams know which decisions they can make independently based on live data, and which require escalation.
- Processes are digitized. The actions triggered by real-time signals, reordering inventory, blocking a transaction, rerouting a shipment, happen through systems, not manual steps.
- Governance guardrails exist. Automated rules define the boundaries of autonomous action so speed does not create compliance or financial risk.
- Training is in place. Teams understand how to interpret live dashboards and distinguish signal from noise, so they do not act on every fluctuation.
The cultural shift from reactive to proactive is the hardest part of real-time adoption. Technology is the easier half of the equation.
Real-world applications that show the value
The clearest way to understand the importance of real-time data is through specific use cases where the cost of delay is concrete and measurable.
-
E-commerce inventory management. U.S. retail e-commerce reached $300.2 billion in Q4 2024, a 9.4% year-over-year increase. That volume creates inventory volatility that batch reporting cannot handle. A live inventory dashboard that alerts the moment a SKU drops below reorder threshold prevents the stockout before it happens. One documented example shows $80,000 in prevented revenue loss from a single real-time inventory alert catching a depletion event before customers hit an out-of-stock page.
-
Manufacturing predictive maintenance. IoT sensors on production equipment stream temperature, vibration, and pressure data continuously. A streaming analytics layer flags anomalies before they become failures. The difference between catching a bearing fault at 2 a.m. versus discovering a broken machine at the morning shift start is measured in hours of downtime and thousands of dollars in emergency repair costs.
-
Financial services fraud detection. Card fraud decisioning happens in milliseconds. A streaming pipeline ingesting transaction data, device fingerprints, and behavioral signals can score a transaction and block it before authorization completes. Batch-based fraud models, by contrast, flag suspicious activity hours after the transaction clears, when recovery is far harder.
-
Customer service operations. A live dashboard showing ticket volume, wait times, and agent availability by queue allows a service manager to shift resources in real time rather than discovering a backlog in the afternoon review meeting. The intervention happens while the problem is still solvable.
-
Sales pipeline visibility. A sales leader with a live CRM view connected to HubSpot can see deal velocity, stage changes, and at-risk opportunities as they develop. Waiting for a weekly pipeline report means coaching conversations happen after the deal has already stalled.
How to implement real-time data views without the common pitfalls
The biggest mistake organizations make is treating real-time analytics as an infrastructure project rather than a business capability project. The technology is solvable. The harder work is defining which decisions need live data, who makes them, and what actions follow.
Here are the most common challenges and how to address them:
- Data quality at speed. Streaming data arrives faster than traditional quality checks can run. Build validation rules into the pipeline itself using tools like Apache Kafka Streams or dbt, so bad data is flagged before it reaches the dashboard rather than after a decision is made on it.
- Integration complexity. Connecting multiple source systems, CRM, ERP, e-commerce platform, to a single real-time view requires CDC pipelines that capture only data changes rather than full extracts. This approach minimizes load on source systems while keeping metrics current.
- Avoiding "speed theater." A fast dashboard that no one acts on is not a real-time capability. It is a display. Tie every live view to a defined decision or action, and measure whether that action is actually taken faster than before.
- Incremental adoption. Start with the highest-value use case, prove the ROI, then scale. Organizations that attempt enterprise-wide real-time transformation simultaneously tend to stall on complexity before delivering any value.
- Tool selection. Power BI and Grafana work well for operational dashboards. Gainable adds a layer that auto-generates apps directly from live data sources like HubSpot and Stripe, removing the configuration overhead that slows most dashboard projects.
Pro Tip: Before selecting a streaming platform, map your highest-priority decision to its required data freshness. Most operational decisions need one to five minute latency, not sub-second. That distinction can save significant infrastructure cost.
Key takeaways
Real-time data views deliver measurable competitive advantage only when technology, organizational empowerment, and clear decision rights work together.
| Point | Details |
|---|---|
| Performance premium is real | Top-quartile real-time firms achieve 50%+ higher revenue growth and net margins than peers. |
| Architecture must match use case | Batch, near real-time, and streaming each serve different decision latency requirements. |
| Organizational readiness is non-negotiable | Empowered employees and clear decision rights determine whether live data translates to faster action. |
| Start with one measurable use case | Proving ROI on a single high-value application builds the case and confidence to scale. |
| Data freshness should match decision velocity | Aligning latency targets to actual decision cycles controls cost without sacrificing business value. |
The uncomfortable truth about real-time data adoption
I have watched organizations spend six figures on streaming infrastructure and end up with faster dashboards that nobody acts on differently. The technology worked. The organizational change did not happen. That is the pattern I see most often, and it is the one that rarely gets discussed in vendor conversations.
The honest framing is this: real-time data views are shifting from a niche capability to a baseline expectation, and the organizations that will extract the most value are not necessarily the ones with the most sophisticated pipelines. They are the ones that have done the harder work of defining what decisions need live data, who owns those decisions, and what the response protocol looks like when the signal fires.
The integration of AI and automated decisioning on top of real-time streams is the next frontier. Tools are already emerging that can draft a response action the moment a data threshold is crossed, reducing the gap between signal and action to near zero. Gainable's approach of auto-generating apps from live data sources and enabling natural language queries points in exactly this direction. The goal is not just visibility. It is velocity from insight to action.
My practical advice: resist the pull toward enterprise-wide transformation. Pick the one decision in your business where the cost of a 24-hour data lag is most visible and most painful. Build a live view for that decision. Measure the before and after. That proof point will do more for your real-time analytics program than any architecture diagram.
— Rickard
See your live data in action with Gainable
If you recognize the gap between the data you have and the decisions you need to make faster, Gainable is built for exactly that situation.
Gainable connects directly to your existing data sources, including HubSpot, Stripe, and Google Sheets, through its data connectors and auto-generates apps and dashboards that reflect your actual workflows. No coding required, no lengthy configuration cycles. You can refine your live views through plain-language queries and have your team acting on real-time data within days rather than months. For operations teams looking to move from reactive to proactive, Gainable's operations apps built on live data are a direct path to the kind of decision velocity this article describes. Explore the full Gainable platform to see how quickly you can close the gap between your data and your decisions.
FAQ
What are real-time data views?
Real-time data views are continuously updated representations of business data with latency from sub-second to under one minute, powered by streaming architectures like Apache Kafka and surfaced through dashboards or applications. They give analysts and leaders a current picture of operations rather than a historical snapshot.
How do real-time data views improve decision-making?
Real-time data compresses the gap between signal detection and operational response, allowing teams to act on inventory shortfalls, fraud signals, or service backlogs while they are still correctable. MIT Sloan research links this capability to 50% higher revenue growth among top-quartile firms.
What is the difference between real-time and near real-time analytics?
Real-time analytics operates at sub-second to second-level latency and is suited for fraud detection and dynamic pricing. Near real-time analytics operates at one to five minute latency and covers most operational dashboard use cases at lower infrastructure cost.
Why do real-time analytics implementations fail?
Most failures trace back to organizational gaps rather than technical ones. When decision rights are unclear or approval chains are slow, live data produces no faster action than batch reports. Empowered employees and defined response protocols are prerequisites for real-time business value.
How should a business start with real-time data views?
Start with the single highest-value use case where the cost of delayed decisions is quantifiable, prove the ROI, then scale. This incremental approach delivers faster results and builds organizational confidence before committing to broader infrastructure investment.