

Real-time dashboards are live, continuously updating visual interfaces that reflect current business data the moment it changes. They sit at the center of modern operational decision-making, giving teams in sales, operations, finance, and ecommerce a live pulse on what is happening right now. Static reports tell you what happened yesterday. Real-time dashboards tell you what is happening at this second, so you can act before a problem compounds. Understanding why real-time dashboards matter is the first step toward building a faster, more responsive organization.
What are the key benefits of real-time dashboards?
Real-time dashboards deliver three core advantages: faster decisions, sharper operational visibility, and a measurable competitive edge. Each one compounds the others.
Faster, data-driven decisions

Companies with high real-time response capabilities see over 50% higher revenue growth and net margins than peers who rely on delayed reporting. That gap exists because speed of insight directly translates into speed of action. A sales manager who sees a pipeline stall in real time can reassign resources the same afternoon, not the following week after a Monday report lands.
Operational monitoring that catches problems early
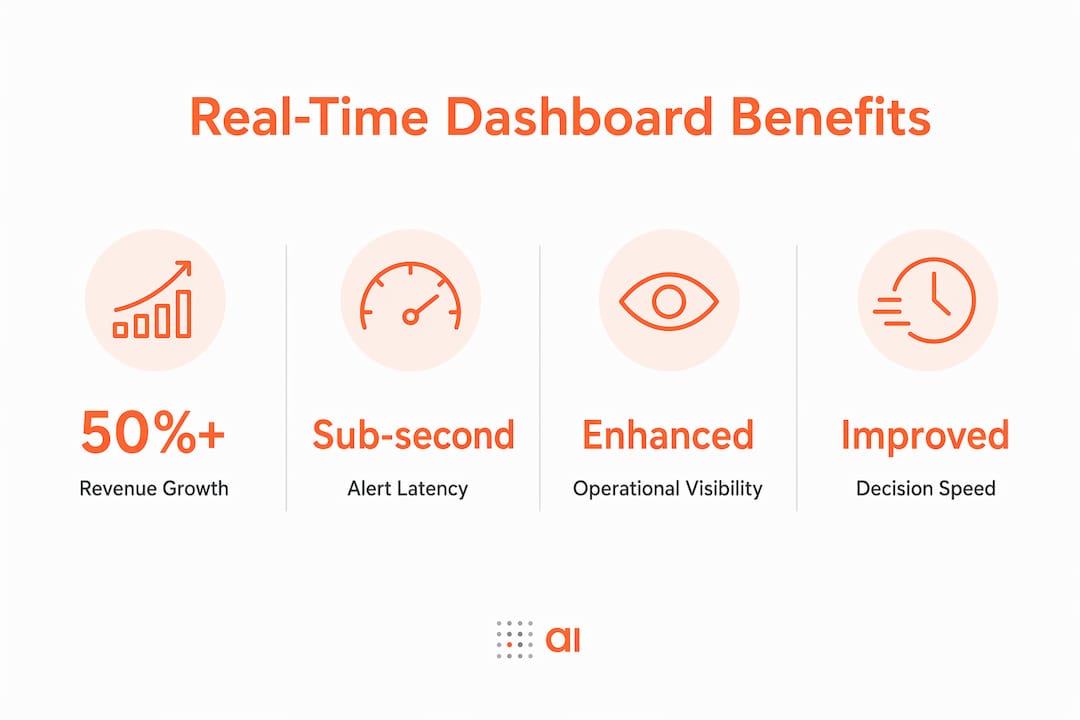
Streaming SQL architectures can reduce alert latency to sub-second ranges, compared to 15–60 seconds with traditional polling systems. In ecommerce, that difference means catching a failed payment gateway before thousands of customers hit an error page. In manufacturing, it means flagging a temperature spike before a batch is ruined.
Customer experience and employee confidence
Real-time data visualization benefits extend beyond the back office. Customer-facing teams respond faster when they see live ticket queues, live inventory counts, and live delivery statuses. Employees stop guessing and start acting. IBM's real-time data streaming research confirms that timely insights are essential for use cases like fraud detection and dynamic pricing, where a delay of even a few seconds changes the outcome entirely.
The importance of real-time dashboards also shows up in these specific industry scenarios:
- Ecommerce: Live conversion rate monitoring lets marketing teams pause underperforming ads within minutes, not hours.
- Financial services: Fraud detection models surface suspicious transactions as they occur, triggering automatic holds before losses mount.
- Supply chain: Live inventory dashboards flag stockouts before fulfillment teams pull orders that cannot ship.
- SaaS operations: Service-level agreement (SLA) monitoring dashboards alert engineers to latency breaches the moment they begin.
"Real-time business advantages arise when employees are empowered to act immediately on trusted data within governance guardrails." — MIT Sloan Management Review
Speed without empowerment is wasted. The organizations that extract the most value from live data are those that pair the dashboard with clear decision rights and the authority to act.
How do real-time dashboards differ from traditional dashboards?
The core difference is data latency. Traditional dashboards typically refresh on scheduled cycles, often every 15 minutes, every hour, or once per day. Real-time dashboards refresh continuously, with updates measured in seconds or fractions of a second.
That gap matters more in some contexts than others. A weekly executive summary can tolerate a 24-hour data lag. A fraud detection dashboard cannot tolerate even a 30-second lag.
Polling vs. streaming architectures
Traditional dashboards use polling: the system queries a database on a fixed schedule and redraws the chart. Streaming architectures push data changes to the dashboard the moment they occur, using tools like streaming SQL with incremental materialized views. RisingWave's streaming SQL approach replaces scheduled polling with event-driven updates, enabling near-instantaneous SLA breach detection.
Near real-time vs. true real-time
Not every "real-time" dashboard is actually real-time. Near real-time typically means updates every 5–60 seconds. True real-time means sub-second refresh. The distinction matters for your architecture budget and your users' cognitive experience.
| Feature | Traditional dashboard | Near real-time dashboard | True real-time dashboard |
|---|---|---|---|
| Refresh interval | Minutes to hours | 5–60 seconds | Sub-second |
| Architecture | Scheduled polling | Micro-batch processing | Event-driven streaming |
| Alert latency | 15–60+ minutes | 5–60 seconds | Under 1 second |
| UX cognitive load | Low | Moderate | High if unmanaged |
| Best use case | Reporting, trends | Operations monitoring | Fraud, SLA, live trading |
Pro Tip: Users often perceive dashboards refreshing every 60 seconds as "real-time." Before investing in true sub-second infrastructure, confirm whether your team actually needs it or whether a 30-second refresh solves the same problem at a fraction of the cost.
When should organizations invest in real-time dashboards?
The decision to invest in real-time monitoring benefits comes down to one question: what does a delay cost you? Fivetran advises investing in true real-time only when delays cause direct monetary loss or measurable risk. Otherwise, near real-time approaches deliver adequate value at lower complexity.
Use this framework to evaluate your need:
- Assess decision criticality. If a 5-minute data lag would cause you to make a materially different decision, you need real-time. If not, near real-time or batch reporting may suffice.
- Quantify delay cost. In fraud detection, a 60-second delay can mean thousands of dollars in unauthorized transactions. In a weekly sales report, a 60-second delay is irrelevant.
- Map your incident response process. If your team cannot act on an alert within seconds anyway, sub-second alerting adds no value. Match your data speed to your response speed.
- Evaluate infrastructure readiness. True real-time dashboards require streaming pipelines, low-latency data stores, and careful schema design. Budget for the full stack, not just the front-end visualization.
- Start with your highest-impact use case. Pilot real-time monitoring on one critical metric, such as payment success rate or SLA compliance, before rolling out broadly.
Pro Tip: If your team is still manually pulling reports from HubSpot or Stripe and pasting them into spreadsheets, you are acting as "human middleware." That is the clearest signal that a live data dashboard would free up significant time and reduce error risk immediately.
Best practices for implementing real-time dashboards
Designing a real-time dashboard well requires more than connecting a data source and picking a chart type. The biggest implementation failures come from ignoring end-to-end latency and cognitive load.
Manage end-to-end latency, not just refresh rate
Latency is the total time from when data changes in your source system to when a user sees the updated number and takes action. That chain includes data ingestion, processing, dashboard render, and user response. MIT Sloan's research frames low end-to-end latency as an operational target, not just a technical spec. A dashboard that refreshes every second but pulls from a data warehouse with a 10-minute sync cycle is not a real-time dashboard.
Control update frequency to protect cognitive performance
Excessive dashboard updates hurt user effectiveness. Constant redraws create visual noise that makes it harder to spot genuine anomalies. Smooth transitions and strategic refresh intervals keep users focused on signals, not motion. A chart that animates smoothly every 10 seconds is more useful than one that flickers every 500 milliseconds.
Here are the key design principles that separate effective real-time dashboards from noisy ones:
- Prioritize signal over speed. Show only the metrics that require immediate action. Every additional metric competes for attention.
- Use color and alerts deliberately. Reserve red and amber for genuine threshold breaches. If everything is highlighted, nothing is.
- Set refresh intervals by metric type. A live transaction counter may need 5-second updates. A daily revenue total needs no more than a 1-minute refresh.
- Build governance into the design. Define who can act on each alert and what the approved response is. Data without a decision owner creates confusion, not agility.
- Test with real users before deploying. A dashboard that looks clean in a demo can feel overwhelming during a live incident. Run it with the actual team under realistic conditions.
Pro Tip: When building dashboards from tools like HubSpot or Stripe, create team dashboards from your existing data first before designing new data collection processes. You likely already have the signals you need.
Key takeaways
Real-time dashboards deliver their greatest value when speed of data is matched with empowered teams, clear decision rights, and refresh intervals calibrated to human cognition.
| Point | Details |
|---|---|
| Speed drives revenue | Companies with real-time response capabilities report over 50% higher revenue growth and margins. |
| Match latency to use case | Fraud detection needs sub-second alerts; most operational dashboards work well at 30–60 second refresh cycles. |
| Empowerment multiplies data speed | Live data only creates advantage when employees have the authority and process to act on it immediately. |
| Cognitive load is a real risk | Refresh rates faster than 2–3 seconds cause cognitive overload; use smooth transitions and strategic intervals instead. |
| Near real-time often suffices | True real-time infrastructure is complex and costly; invest in it only when delays cause direct monetary loss. |
The uncomfortable truth about real-time dashboards
I have worked with data teams that spent months building sub-second streaming pipelines, only to watch their dashboards sit ignored on a monitor in the corner of the office. The data was fast. The decisions were not.
The misconception I see most often is that faster refresh rates automatically produce better outcomes. They do not. What produces better outcomes is a team that knows exactly which number to watch, what threshold triggers action, and who is authorized to act the moment that threshold is crossed. Without that clarity, a real-time dashboard is just an expensive screensaver.
The organizations that get the most from live data are not necessarily the ones with the most sophisticated infrastructure. They are the ones that have done the harder work of digitizing their processes, defining decision rights, and building a culture where front-line managers trust the data enough to act on it without waiting for approval from three levels up.
Real-time data visualization benefits are real and well-documented. But they are unlocked by organizational design, not just technology. Before you invest in streaming SQL or a new dashboard platform, ask yourself: if your team had this data right now, would they know what to do with it? If the answer is no, start there.
— Rickard
How Gainable helps you build live dashboards fast
Building a real-time dashboard used to mean months of engineering work. Gainable changes that by connecting directly to your existing data sources, including HubSpot, Stripe, and Google Sheets, and auto-generating live dashboards that reflect your actual workflows.
No coding is required. You describe what you need in plain language, and Gainable builds the app around your data. Teams get live dashboards and charts from their existing data within hours, not months. Gainable's data connectors keep every view current, so your team always sees the latest numbers without manual exports or copy-paste workflows. If you are ready to stop acting as human middleware and start making faster decisions, Gainable is built for exactly that.
FAQ
What is a real-time dashboard?
A real-time dashboard is a live, continuously updating visual interface that displays current business metrics as data changes. It differs from traditional dashboards by refreshing in seconds or sub-seconds rather than on scheduled hourly or daily cycles.
How do real-time dashboards improve decision-making?
Companies with real-time response capabilities report over 50% higher revenue growth and net margins, according to MIT Sloan Management Review. Live data removes the lag between an event occurring and a decision-maker seeing it, which compresses response time from hours to minutes.
Do all businesses need true real-time dashboards?
No. Fivetran advises investing in true real-time infrastructure only when data delays cause direct monetary loss or measurable risk. For most operational use cases, near real-time dashboards refreshing every 30–60 seconds deliver equivalent value at lower cost and complexity.
What causes cognitive overload in real-time dashboards?
Refresh rates faster than 2–3 seconds and constant visual redraws overwhelm users, making it harder to spot genuine anomalies. Sumboard's research shows that smooth transitions and strategic refresh intervals protect user focus and improve decision quality.
What data sources can feed a real-time dashboard?
Common sources include CRM platforms like HubSpot, payment processors like Stripe, ERP systems, and cloud databases. Tools like Gainable connect these sources directly and auto-generate live dashboards without requiring custom engineering work.