
TL;DR
- Most operations, accounting, sales, and warehouse managers spend hours per week manually translating data for their teams.
- The problem is structural. Your systems weren't designed to share information with the people who need it.
- Fixing it doesn't require IT, a developer, or an expensive software project.
- The fastest path out is connecting your data to a tool that builds the app for you, instead of asking you to build it yourself.
You didn't sign up to be the data team
Somewhere along the way, you became the person.
The person who exports from the CRM every morning. The person who cleans up the spreadsheet so everyone else can read it. The person who gets the Slack message when someone can't find a number. The person whose vacation creates a data blackout for the whole team.
This is not your job title. It's a role you drifted into because the gap between your company's data systems and your team's ability to use them needed to be filled, and you were competent enough to fill it.
You are the human middleware.
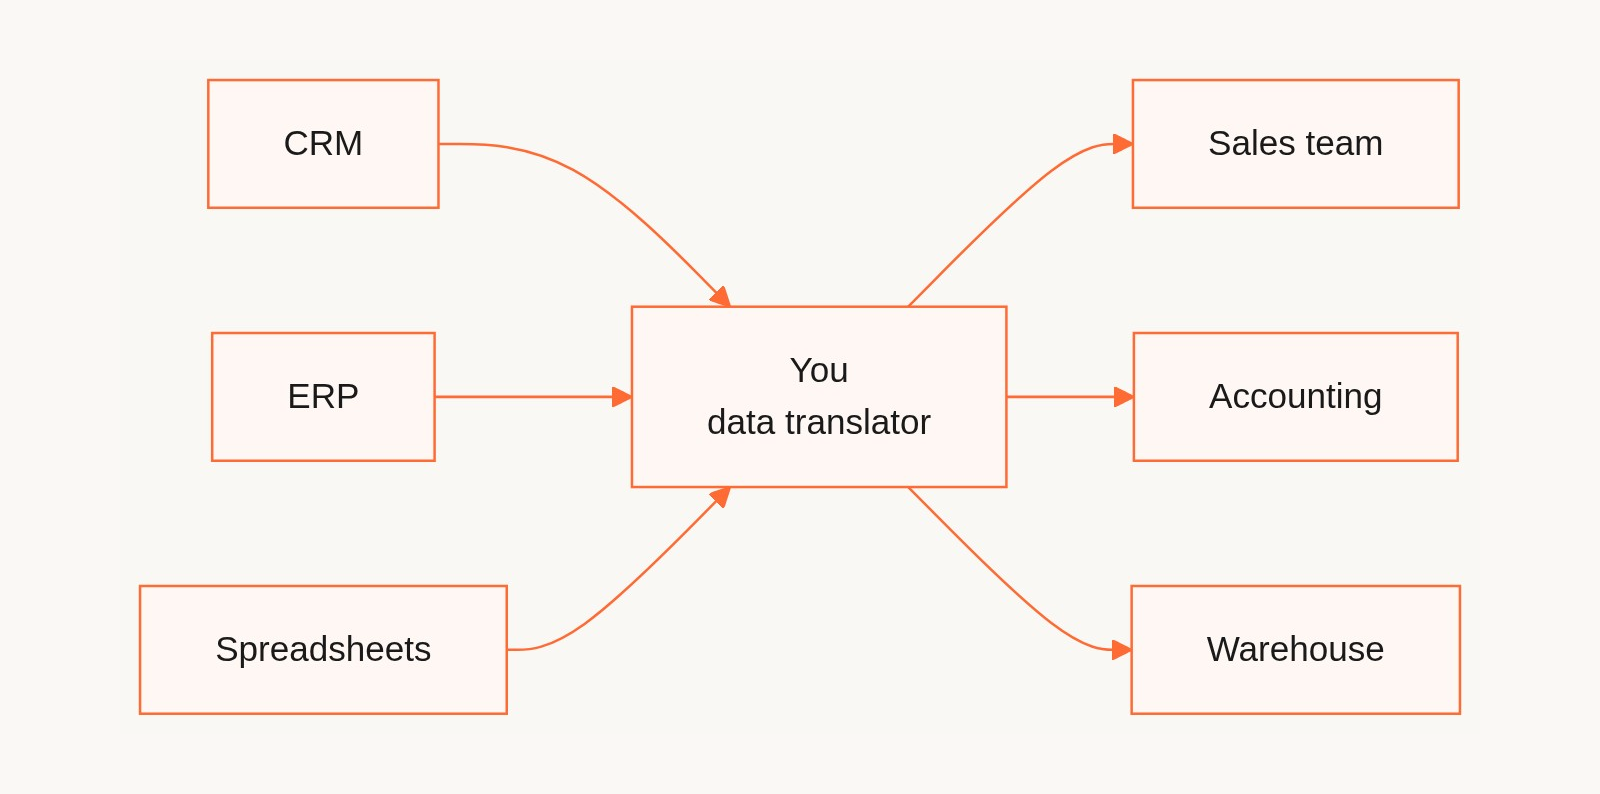
I've watched this pattern repeat across companies for 25 years. The names change, the tools change, but the role you got pulled into doesn't. And it's costing you hours every week that you should be spending on the work you were hired to do.
Why this keeps happening
The data systems your company runs (CRMs, ERPs, spreadsheets, databases) were built to store and track data, not to present it to the people who need to act on it.
Salesforce stores your deals. It doesn't surface the five you need to call today in the format that makes sense to your team. QuickBooks records every payment. It doesn't give your controller a clean view of overdue accounts with notes attached. Your ERP tracks every SKU. It doesn't give your warehouse team a live view of what needs to move this week.
So someone has to bridge that gap. That someone is usually a manager with spreadsheet skills, a good eye for what the team needs, and no one to tell them to stop doing it manually.
Six signs you are the human middleware:
- You export data from at least one system every day and reformat it for someone else.
- When you're out sick, someone's morning is broken.
- Your team has learned to ask you for numbers instead of looking themselves.
- You've built at least one spreadsheet that only you fully understand.
- You've tried to document your process and stopped because it was too complicated.
- You've thought about what would happen to your data if you left the company.
If three or more of those land, you are the human middleware. And you have been for long enough.
What you've probably already tried
Better spreadsheets. You've made the master sheet cleaner, color-coded it, added drop-downs, locked cells, protected sheets. It still gets corrupted. Someone opens it on mobile and moves a row. The shared link gets sent to the wrong person.
Sending reports on a schedule. You set up a recurring email with an attached file. Now you have to update the file every time, which means the recurring email is a recurring commitment. And people reply to it asking for clarifications that send you back into the data.
Dashboard tools your company already has. Power BI is on the server. Nobody configured it for your team's workflow. The IT department has eighteen other priorities. The dashboard shows data that's twelve hours old and doesn't answer the questions your team asks.
Asking IT. IT said yes, put it in the queue, gave it a ticket number, and three months later nothing has changed. Or they built something that technically works but doesn't match how your team operates.
None of these fixed the underlying problem. The underlying problem is that you have data in multiple systems and no app that surfaces it for your team in a form they can use.
What solves it
The fix is replacing the spreadsheet-as-app with an app. Something your team can use without you in the loop.
For that to work, three things have to be true.
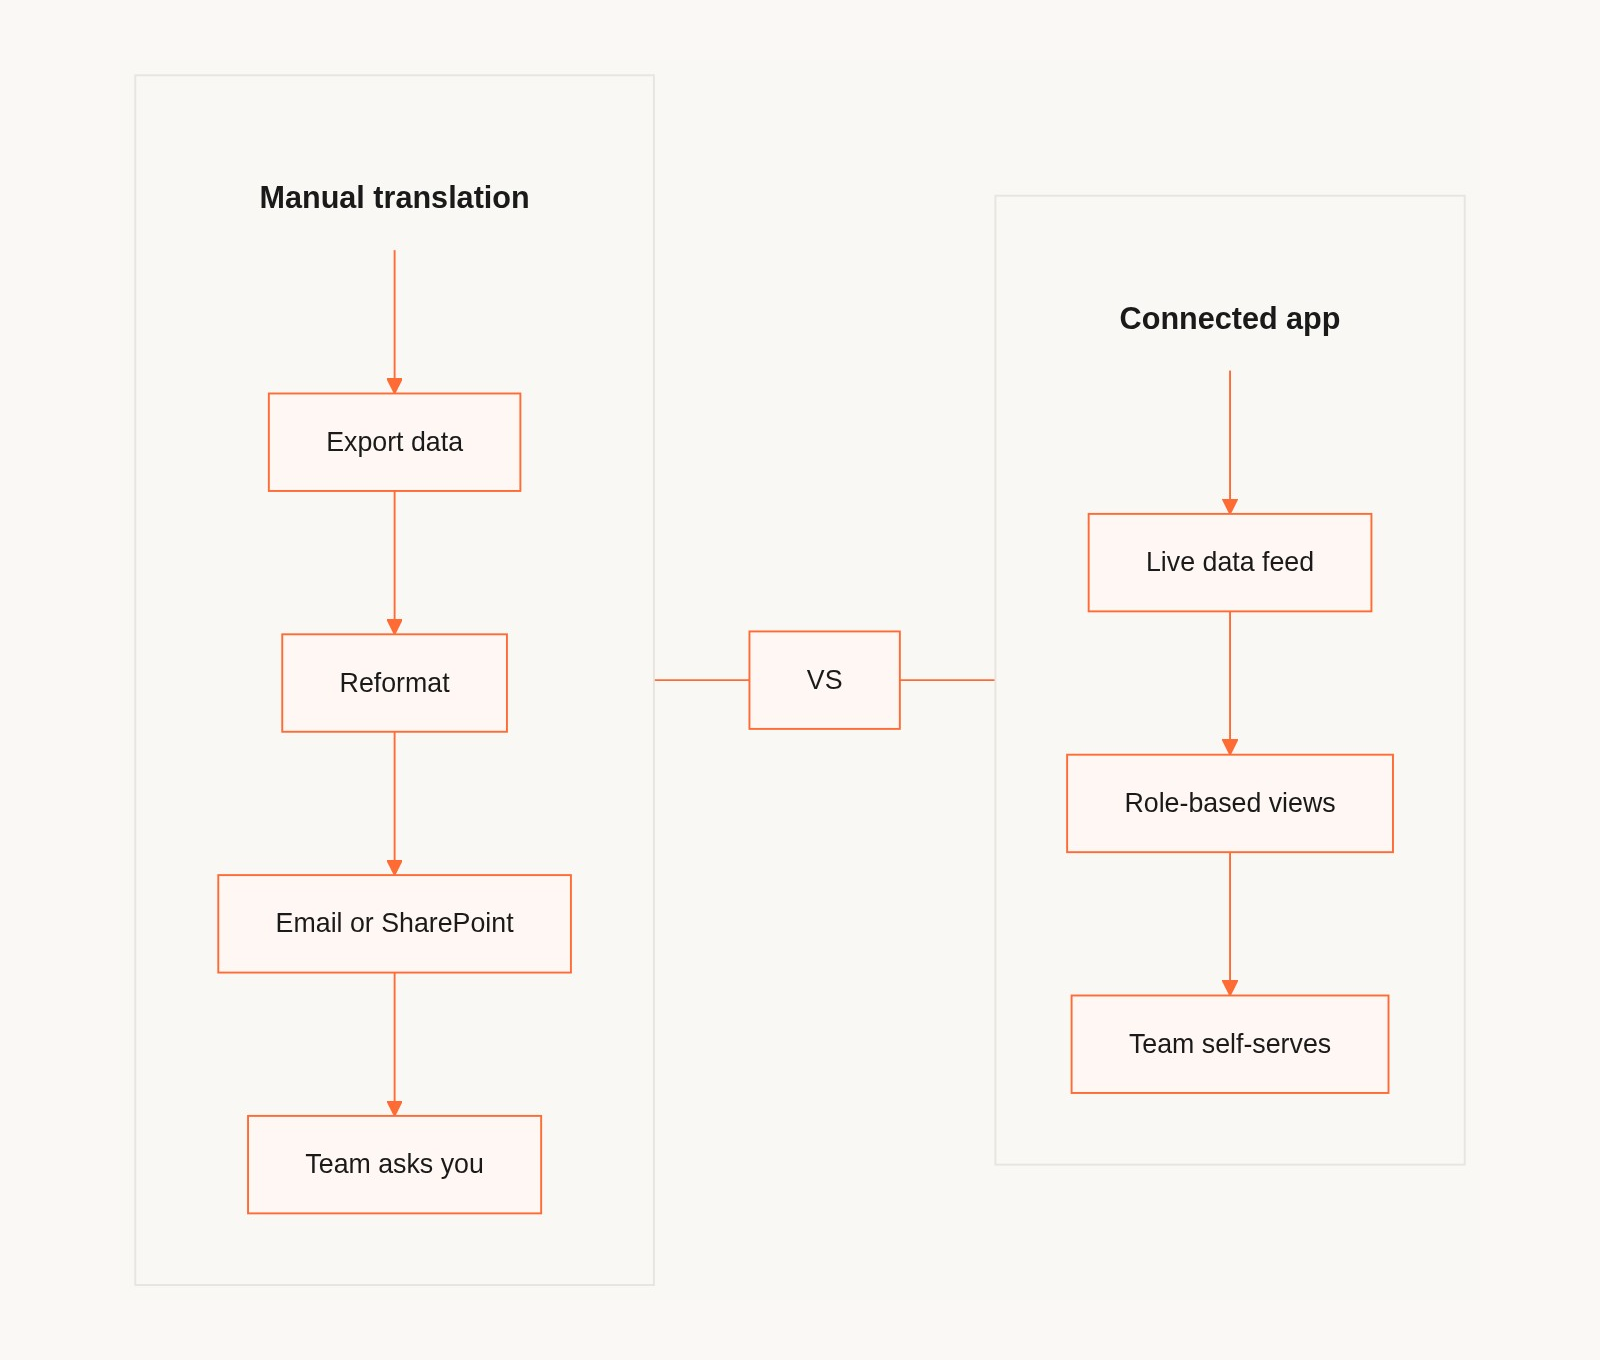
1. It connects to your live data sources. Not a copy of the data you manually pasted in. Live data from HubSpot, Google Sheets, Stripe, Salesforce, or whatever system you're currently exporting from. When the source updates, the app updates. You stop being in the chain.
2. It shows the right view to the right person. Your team doesn't need the full data export. They need the filtered, formatted version that answers their question. Role-based views mean your warehouse team sees their data, your accounting team sees theirs, and nobody is looking at a spreadsheet they can accidentally corrupt.
3. You didn't need a developer to build it. If it takes three months and an IT ticket, the gap gets filled with a new spreadsheet in the meantime and you're back where you started. The build has to be fast enough to ship before the next quarterly fire.
The fastest way to build a team app from your existing data
This is the scenario Gainable was built for. You connect your data sources (HubSpot, Google Sheets, Stripe, Airtable, Salesforce, and more) and instead of asking you to design an app, the AI reads your data and infers the app structure for you.
Field names, data types, relationships. A sales dataset becomes a pipeline view with deal stages and owner assignments. A collections spreadsheet becomes a shared tracking app with notes on records and role-based access. A warehouse inventory sheet becomes a live view your team can query without calling you.
The loop looks like this:
- Connect your data sources (HubSpot, Google Sheets, Stripe, Salesforce, or your own spreadsheet).
- The AI reads the data and asks two to three clarifying questions about how you want it structured.
- A working app is built in under 15 minutes. Dashboards, views, forms, and an AI copilot, all generated from your schema.
- You refine in plain language: "show only open accounts," "add a status field," "give accounting view-only access."
- You publish it with one click and share the link with your team.

After that, Gaia Autopilot watches your connected data and drafts work for your approval: follow-ups on stalled items, anomaly alerts, weekly summaries. You review and approve. Nothing leaves the building without your say-so. But for the first time, you're making decisions instead of moving data around.
What this looks like in practice
For an accounting manager with seven payment sources, a daily reconciliation spreadsheet, and a collections tracking sheet shared over SharePoint: instead of managing a file that anyone with the link can corrupt, you have a shared app where the AR team sees the accounts they own, notes live on the records instead of in Slack, and the controller has a read-only dashboard for board meetings. You're still the person who understands the data. You're no longer the bottleneck for accessing it.
For an operations or warehouse manager who exports from an ERP every morning and emails a formatted sheet to the team: your team opens an app instead of an email attachment. The data is live, not twelve hours old. You stop spending an hour every morning on a task that adds no judgment, only translation.
For an insurance or sales manager who built a Google Sheet outside the company's official systems because the official dashboard is unreliable: you have an app connected to the same data, with role-based views for your adjusters or reps, and an audit trail. You didn't need permission or IT. It runs the same way your sheet does, except your team can use it directly.
The collaboration gap nobody talks about
There's a second problem underneath the data translation problem. The conversation about your data happens everywhere except on the data itself.
A line in the collections sheet is unclear. Shannon sends a Slack message. Gets an answer four hours later. By then she's moved on. A deal looks stalled. Travis emails the adjuster. The answer comes back in a reply to a three-week-old thread. Nobody can find it six months later.
When notes, comments, and context live on the records themselves, in the same app where the data lives, you get an audit trail. You can see who changed what and when. You can find the context for a decision that was made eight months ago. You stop losing institutional knowledge to chat apps.
The objection I hear most: "I need this to be reliable. I can't have my team dependent on a tool I set up."
This is the right concern and it deserves a direct answer.
Your current system, a spreadsheet over SharePoint or an email with an attachment, is not reliable either. It gets corrupted. It breaks when someone opens it on mobile. It goes dark when you're on vacation.
The question is not "spreadsheet vs. app." It's "fragile manual process vs. live connected app." A connected app with role-based access and a live data feed is more reliable than a file anyone can accidentally overwrite.
FAQ
Q: How is this different from just building a better spreadsheet?
A spreadsheet is a file. Anyone with access can change it, intentionally or not. A team app has role-based permissions, an audit trail, and a live connection to your data sources. Your team can use it without modifying the underlying data.
Q: My company already has Power BI, Tableau, or Salesforce dashboards. Why isn't that enough?
Corporate dashboard tools show data at the org level. They're rarely configured for how a specific team works day to day. Gainable is built around your data and your team's workflow, not the company's reporting structure. And you don't need IT to configure it.
Q: What if I'm the only person who would use this? Is it still worth it?
If you're the only person currently accessing the data, the question is whether you want to stay that way. Building the app now means you can add your team later, document your workflow in a tool that doesn't live only in your head, and stop being the single point of failure.
Q: What does it cost to fix this?
Less than the hourly cost of the time you spend manually translating data every week. If you spend three hours a week on manual data work and value your time at $50 an hour, that's $7,500 a year in hidden cost. Most tools in this category run $30 to $150 per month.
Q: Do I need IT approval to use a tool like this?
For most use cases, no. You're connecting to data you already have access to (your own Google Sheets, your Salesforce account, your Stripe data) and building a view for your team. This is no different from building a shared spreadsheet, except it's connected to live data and has proper access controls.
The point
You became the human middleware because you were good at your job. But being the data translator is not the same as doing your job. It's what happens before you get to do your job.
The data is already there. You don't need to build anything from scratch. You need a tool that reads your data and turns it into the app your team has been waiting for.
That's the version of your morning where the report is waiting for you, instead of you building the report.