
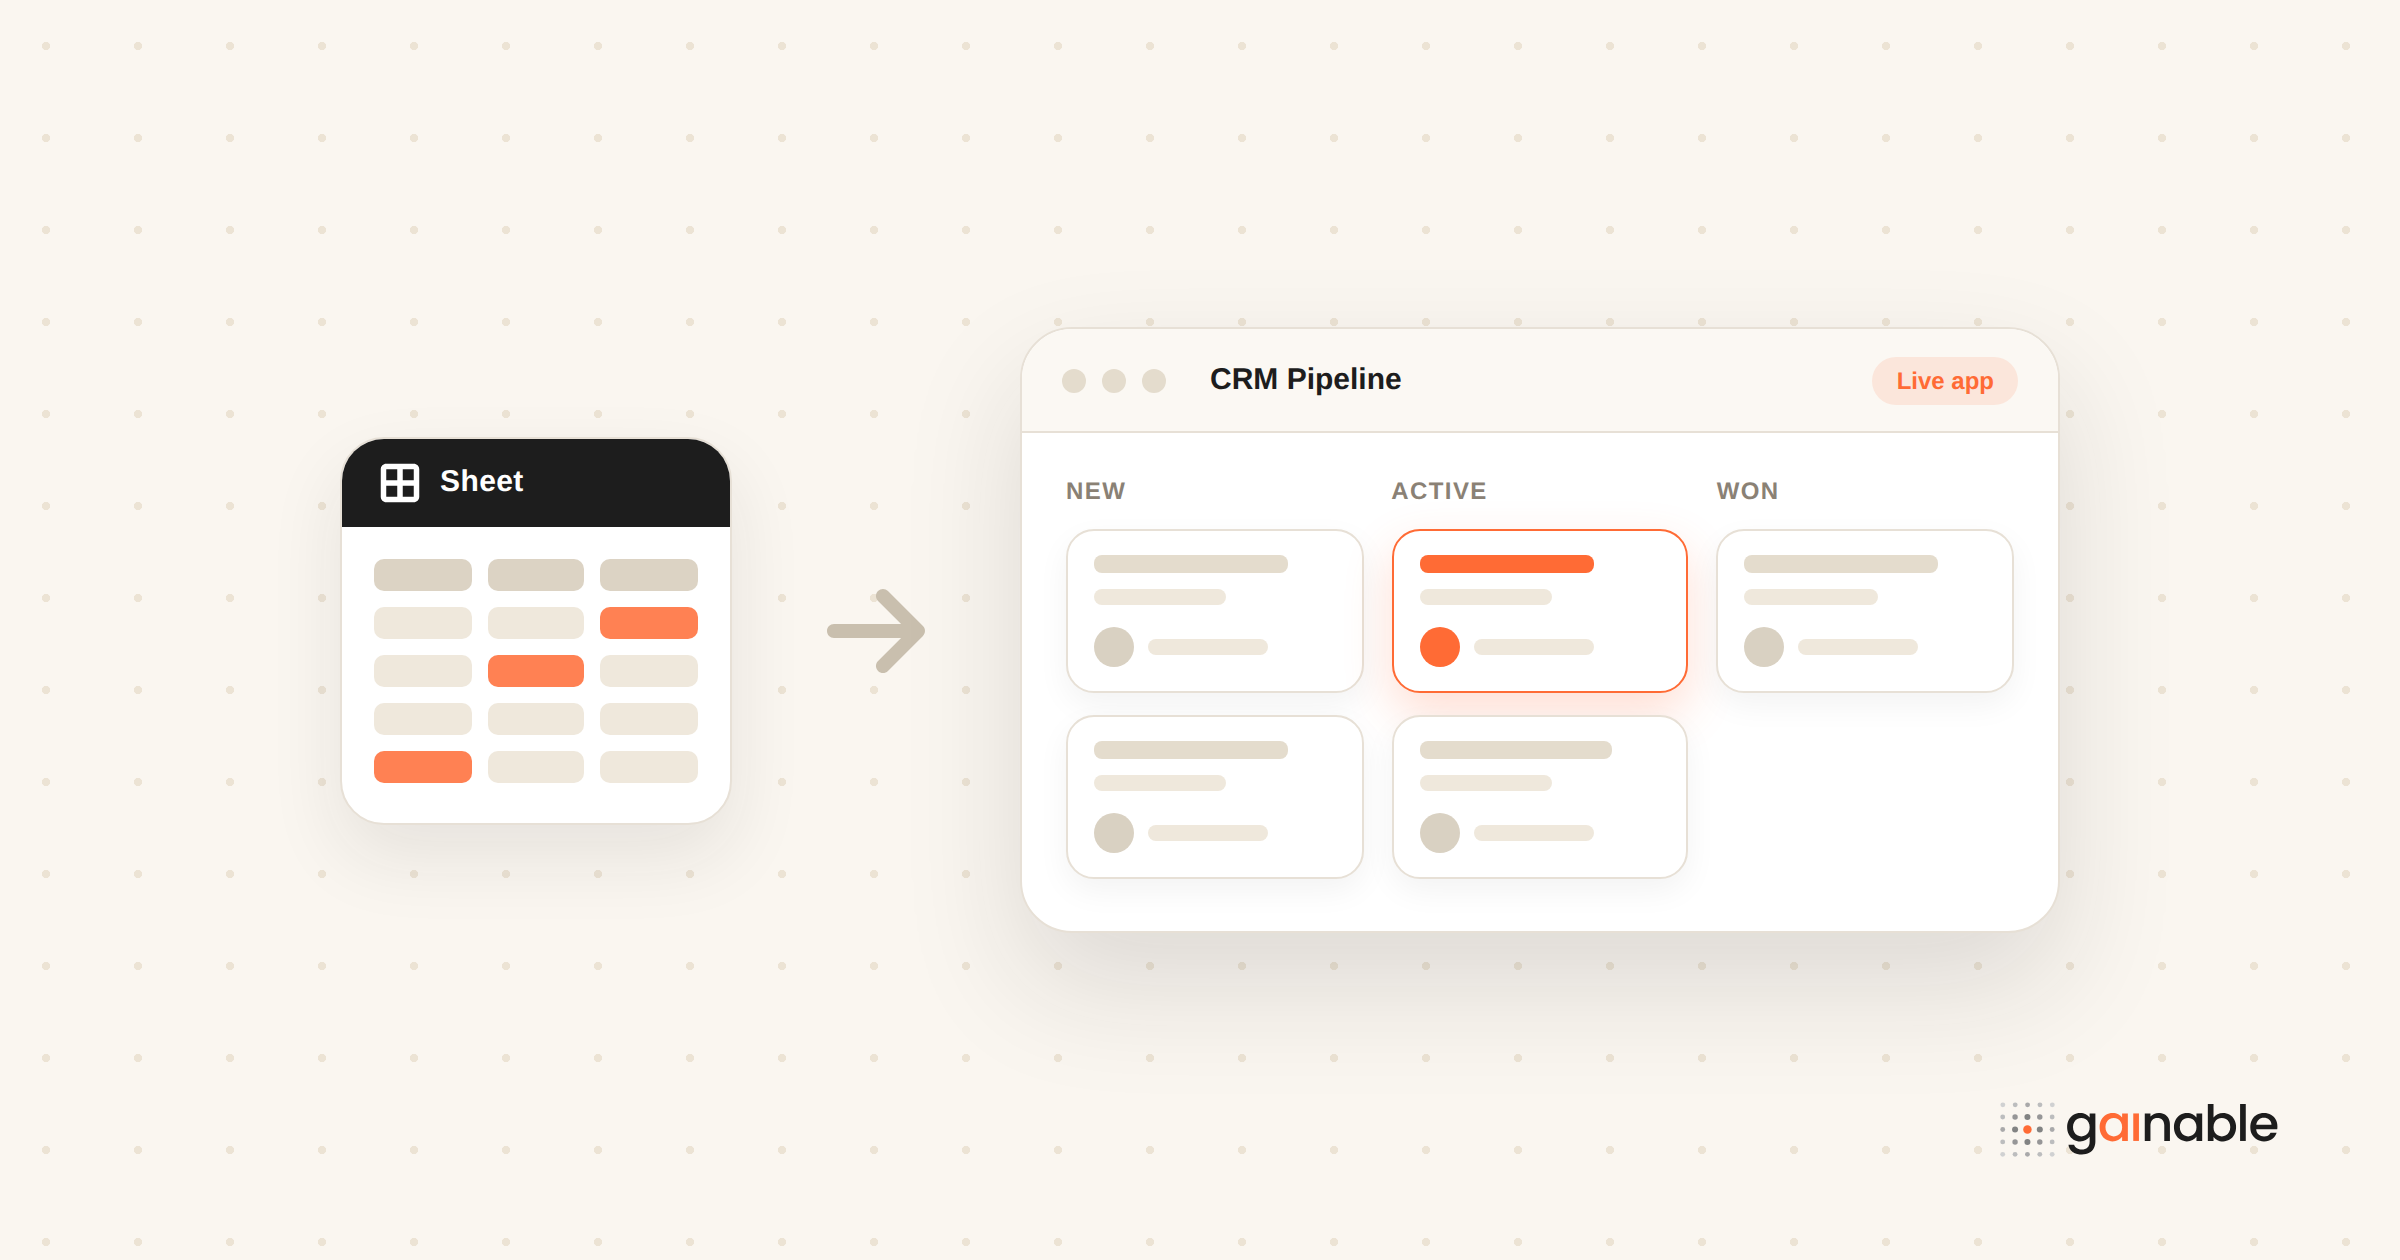
Yes, Google Sheets works as a lightweight CRM for solo sellers and very small teams with a simple pipeline. Copy the template below, set your owner and stage columns, and you’ll have a working system in under an hour. It won’t replace a dedicated platform once you’re juggling multiple editors or hundreds of active deals, but for now, it’s the fastest, cheapest way to stop losing track of who you talked to and when.
TL;DR:
- Using a Google Sheets CRM is effective for solo sellers and small teams with fewer than fifty active deals to track, but it becomes problematic beyond that scale.
- Core setup requires a one-row-per-record structure with unique IDs for contacts, companies, and deals, as well as dropdown lists for consistency.
- Proper linking between tabs with formulas like VLOOKUP, XLOOKUP, and QUERY simplifies data management and enhances usability for daily operations.
- Dashboards should focus on key metrics such as total contacts, new contacts this month, pipeline value, deals by stage, and overdue follow-ups, automatically updating with linked data.
- Automation options like Google Forms and Zapier help reduce manual entry, but spreadsheets eventually need migration when collaboration or data volume outgrows their capabilities.
Table of Contents
- What Is a Google Sheets CRM Template?
- Essential Tabs and Fields for a Working Spreadsheet CRM
- How Do You Build the Formulas and Views?
- What Should Your CRM Dashboard Actually Show?
- Which Automations Actually Reduce Manual Work?
- When Should You Migrate Off Google Sheets?
- How Do You Turn a Spreadsheet Into a Real App?
- When Sheets Wins and When It Doesn’t
- Ready to Turn Your Spreadsheet Into a Live App?
- Sources
What Is a Google Sheets CRM Template?
A Google Sheets CRM is exactly what it sounds like: a spreadsheet built with the specific job of tracking contacts, deals, and follow-ups instead of just holding random data. Where a typical spreadsheet is a junk drawer, a CRM template is organized like a filing cabinet, with tabs that talk to each other and formulas that do the counting for you.
You don’t have to build this from scratch. Zapier’s free copyable CRM template follows a four-step structure that’s become the standard approach: a customer database, an interaction log, data validation for consistency, and a dashboard that pulls it all together. Grab a copy of any well-built template like this, and you’re not starting from a blank sheet. You’re starting from a working system.
Here’s the setup that matters most:
- Contacts tab. One row per person, with a unique ID so you never confuse two “John Smiths.”
- Companies tab. For B2B sellers who track accounts separately from individual contacts.
- Deals tab. Your pipeline. Each deal links back to a contact and a company.
- Activities tab. Every call, email, and meeting, logged with a date and outcome.
- Dashboard tab. The formulas and charts that turn raw rows into a picture you can act on.
- Lists tab. The hidden engine behind your dropdown menus.
- Settings tab. Where you park anything that doesn’t fit elsewhere.
Before you touch a single formula, do three things. First, clear out any sample data so you’re not accidentally emailing a fictional lead. Second, set sharing permissions, because a CRM with “anyone with the link can edit” access is a liability, not a tool. Third, freeze the header row on every tab, so scrolling through 200 rows of contacts doesn’t leave you guessing which column is which.
Essential Tabs and Fields for a Working Spreadsheet CRM
The difference between a spreadsheet that works and one that quietly falls apart in month three comes down to structure. Follow a one-row-per-record rule on every tab. No exceptions, no “I’ll just add a note below this row.” Each contact, company, and deal gets its own row and its own ID.
Give each entity a real unique ID (Contact ID, Company ID, Deal ID) rather than relying on names, which duplicate more often than you’d expect. Here’s the field structure that holds up over time:
- Contacts: name, email, phone, owner, source, last contact date, next follow-up date.
- Deals: deal name, linked contact ID, linked company ID, stage, value, close date, owner.
- Activities: date, contact ID, activity type (call, email, meeting), notes, outcome.
- Lists: every dropdown value you use elsewhere, stored once so it’s consistent everywhere.
That Lists tab does more work than people expect. Vonsel’s guide on building a Sheets CRM recommends turning deal status into a dropdown pulled from a Lists tab, then using conditional formatting to flag anything overdue in red. Set this up with Data > Data validation, pointing each dropdown at your Lists tab for owners, stages, sources, and activity types. Free-text stage fields are how pipelines turn into unreadable messes within a month.
Lock down your formula-heavy tabs (Dashboard especially) with protected ranges, so a well-meaning teammate doesn’t overwrite a SUMIF formula while trying to add a note.
Pro Tip: Add a “Days in Stage” column on your Deals tab using a simple date subtraction formula. Deals that sit in one stage for two weeks or more are usually the ones about to go cold, and this column surfaces them before you have to ask.
How Do You Build the Formulas and Views?
Start with structure before formulas. Create your tabs (Contacts, Companies, Deals, Activities, Dashboard, Lists), freeze the header row on each, and format your date columns as dates and currency columns as currency. Skipping this step is why so many CRM spreadsheets end up with “$5,000” stored as text that no SUM formula can touch.
Next, build your dropdowns. Go to Data > Data validation, select the column you want to control (Stage, Owner, Source), and point it at a named range on your Lists tab. This is what keeps “Closed Won,” “closed won,” and “Won” from becoming three separate categories in your reporting.
Now link your tabs together. This is the step that turns three disconnected sheets into one system:
- Use
VLOOKUPor the newerXLOOKUPto pull a contact’s email and phone number directly into your Deals tab based on Contact ID. - Use
INDEX-MATCHwhen you need a lookup that can search left as well as right, which VLOOKUP can’t do. - A basic pattern looks like:
=XLOOKUP(A2, Contacts!A:A, Contacts!C:C)to pull an email address into your Deals row based on matching Contact ID.
Once your data is linked, build the views your team will actually use daily. A rep-specific pipeline view uses FILTER to show only that person’s open deals:
=FILTER(Deals!A:F, Deals!D:D="Open", Deals!G:G="Maria")
For a “Today” follow-up view that pulls every contact due for outreach, QUERY is more flexible than FILTER for anything involving sorting or multiple conditions:
=QUERY(Contacts!A:H, "select A, B, F where F = date '"&TEXT(TODAY(),"yyyy-mm-dd")&"'")
Build these once, and every rep opens their own filtered view instead of scrolling through everyone’s deals to find their own. That single change saves more time than any other step in this process.
What Should Your CRM Dashboard Actually Show?
Your dashboard exists to answer five questions at a glance: how many customers do you have, how many are new this period, what’s your open pipeline worth, how are deals distributed across stages, and which follow-ups are overdue right now. Everything else is decoration.
Here’s how the core formulas map to those questions:
| Metric | Formula pattern | What it tells you |
|---|---|---|
| Total customers | =COUNTA(Contacts!A2:A) |
Total active contact records |
| New this month | =COUNTIFS(Contacts!F:F,">="&DATE(2024,1,1)) |
Growth rate in your pipeline |
| Open pipeline value | =SUMIF(Deals!D:D,"Open",Deals!E:E) |
Total dollar value still in play |
| Deals by stage | =COUNTIFS(Deals!D:D,"Negotiation") |
Where deals bottleneck |
| Overdue follow-ups | =COUNTIF(Contacts!G:G,"<"&TODAY()) |
How many people are being neglected |
Pipedrive’s template guidance points out that linking sheets properly means moving a deal to a new stage automatically updates every dashboard number that depends on it, rather than requiring a manual refresh. That’s the entire point of building it this way instead of just typing numbers into a summary box by hand.
For visualization, a pivot chart works well for deals by stage since it updates automatically as your data changes. A simple line chart tracking interactions logged per week shows whether your outreach pace is actually holding steady or quietly slipping. A “Recent Activity” block built with QUERY sorted by date descending gives you a live feed of what’s happened without opening the Activities tab directly. For more formula patterns and chart-building specifics, this guide on building sales dashboards from CRM data goes deeper into layout choices.
Which Automations Actually Reduce Manual Work?
A spreadsheet only stays useful if you’re not manually retyping every new lead. Google Forms solves the intake problem directly: connect a form to your Contacts tab, and every submission becomes a new row automatically, no copy-paste required.
Zapier is where most of the real automation lives, connecting Sheets to tools it can’t talk to natively:
- New row in Contacts → automatically add the person to a mailing list.
- New form response → automatically create a corresponding deal on your Deals tab.
- Updated row (stage changed to “Closed Lost”) → trigger a Slack or email reminder to the owner.
For anything more custom, Apps Script can send scheduled email reminders for overdue follow-ups or trigger actions when a specific cell changes. Keep the limits in mind: scripts have execution time caps, and OAuth tokens for connected services expire and need periodic reauthorization, which catches people off guard when a “working” automation silently stops.
Pro Tip: If you set up a scheduled Apps Script reminder, store the last-run timestamp using PropertiesService so you don’t accidentally send the same overdue-follow-up email five times because the trigger fired twice.
The bigger caveat: none of these connectors give you true two-way sync the way a real CRM does. Data flows one direction, and if two tools update the same record at once, one of those updates quietly loses. Weigh how automation fits into your broader CRM workflow before building anything mission-critical on top of Zapier triggers alone.
When Should You Migrate Off Google Sheets?
Every spreadsheet CRM eventually hits a wall, and the wall shows up in predictable ways. Two people editing the Deals tab at once causes silent overwrites with no warning. There’s no audit trail showing who changed a deal’s value last Tuesday. Native reminders don’t exist. Sheets itself starts to slow down noticeably once you’re pushing several thousand rows with heavy formulas.
Kixie’s 2026 guide points out that newer features like Gemini-assisted table setup make building the sheet easier, but they don’t solve the underlying problem: Sheets still has no native call logging or role-based access control.
Watch for these operational triggers instead of waiting for a crisis:
- You’ve added a third or fourth regular editor to the Deals tab.
- Your active lead count has grown beyond what a spreadsheet can clearly track, and tracking who owns what is getting fuzzy.
- Follow-ups are getting missed repeatedly, not occasionally.
- You’re manually exporting data every week just to share it with someone else.
When one of these hits, the migration itself is straightforward: export your tabs as CSVs, map each spreadsheet column to its equivalent field in the new system, run a test import with a small batch first, then verify your activity logs and owner assignments carried over correctly before switching your team over for good.
How Do You Turn a Spreadsheet Into a Real App?
The columns you’ve already built (Contacts, Deals, Activities, Stage, Owner) map almost directly onto app fields. What changes is what wraps around them: authentication so each rep logs in as themselves, role-based permissions so junior reps can’t edit someone else’s pipeline, and dashboards that update live instead of on a manual refresh.
Gainable reads an existing Google Sheet, merges it into a single data model, and builds a working application from the columns already there, no rebuilding from scratch required. Two-way sync means updates in the app write back to the original sheet instead of leaving it stale.
The spreadsheet stops being the system of record and starts being one input into something bigger: audit logs that show who changed what, collaboration that happens inside the record itself instead of in a separate email thread, and automation agents that clear recurring busywork before it piles up on someone’s desk.
For a deeper look at the mechanics, this guide on converting a spreadsheet into an app walks through the process step by step.
When Sheets Wins and When It Doesn’t
Here’s the honest trade-off nobody selling you software wants to say out loud: for one person managing forty deals, a spreadsheet CRM is genuinely the right tool. It’s free, fast to set up, and flexible enough to change on the fly without a support ticket. The moment you add a second regular editor or your lead count climbs past fifty, that same flexibility becomes a liability instead of a feature.
Use the template. Build the dropdowns. Run the migration checklist honestly when you hit one of the triggers above, instead of waiting for a missed follow-up to force the decision for you.
— Rickard
Ready to Turn Your Spreadsheet Into a Live App?
If your Google Sheet has outgrown what dropdowns and lookup formulas can hold together, Gainable gets you to a real app faster than rebuilding your process from scratch in a new tool. Point it at your existing sheet, and it reads the columns you’ve already built, merges them into one data model, and generates a working application, complete with login, roles, and dashboards, in minutes instead of weeks.
What you get on top of the sheet you already have:
- Two-way sync, so the app and your spreadsheet stay in agreement instead of one going stale.
- Audit logs and role-based access, the two things a spreadsheet CRM can’t do natively.
- Chat and comments that live inside each record, so context never gets lost in a separate email thread.
Start with the App Builder to see how your columns become working screens, or check the data connectors page if you’re already juggling Sheets alongside HubSpot or Stripe. Request a demo and bring your own spreadsheet to see it converted live.
Sources
- Google Sheets CRM Guide for 2026
- Google Sheets as a CRM: How to Build One (and Its Limits) - Vonsel
- Free Google Sheets CRM template: complete setup and best practices