

You can auto-generate sales reports from HubSpot right now using two native tools: the Sales Analytics Suite and the Custom Report Builder. No third-party software required, no spreadsheet exports, no waiting on someone else to compile the numbers. HubSpot pulls from your CRM data, applies your filters, and keeps reports current automatically.
Here is what you get out of the box:
- Sales Analytics Suite: Pre-built reports covering Activity and Leads, Deals, and Forecast and Revenue. Pick one, customize the filters, and save it to a dashboard in minutes.
- Custom Report Builder: Multi-object reporting across contacts, deals, companies, emails, and website data. Requires Create/own and Edit report permissions.
- Breeze AI: HubSpot’s AI report generation tool lets you type a plain-language question like “Who closed the most deals last quarter?” and generates a report template with recommended filters and a visualization automatically.
- Automated refresh: Custom reports refresh every two hours automatically. You can trigger a manual refresh every 15 minutes when you need current data before a meeting.
- Scheduled distribution: Send reports and dashboards to your team via email, Slack, or Google Chat on a recurring schedule configured to suit your needs.
The biggest shift automated reporting delivers is moving your team from reactive spreadsheet pulls to a live, always-current view of pipeline health. Automated reporting connects marketing, sales, and service data into standardized dashboards that reduce manual effort and cut down on errors.
How to create sales reports with HubSpot’s Sales Analytics Suite
The Sales Analytics Suite is your fastest path to a working sales report. It holds dozens of pre-built reports that cover the metrics most sales managers actually care about, and you can customize any of them without touching the Custom Report Builder.
Navigating to the suite
- In your HubSpot account, click More, then go to Reporting > Reports.
- In the left sidebar, click Sales.
- Browse the report categories or use the search bar to find a specific report.
- Select the report you want to work with.
Report types and what they tell you
The suite organizes reports into three main categories:
- Activity and Leads: Tracks prospecting touches, call outcomes, email sequences, and lead conversion rates. Useful for SDR managers reviewing rep activity against quota.
- Deals: Covers deal stage progression, win/loss rates, average deal size, and time in stage. Sales managers use these to spot where pipeline velocity slows down.
- Forecast and Revenue: Shows projected close amounts by period, weighted pipeline, and actual revenue against target. This is the report your VP of Sales wants every Monday morning.
Saving and sharing reports
Once you have customized a report’s filters, date range, or grouping, click Save report to add it to your reports list or pin it directly to a dashboard. To share a customized view with a colleague, use the Actions dropdown and select Copy report URL. Anyone with access to sales reports in your HubSpot account can open that link.
Pro Tip: Build a dedicated Sales Performance dashboard and pin your top three reports there. That way, your team opens one URL and sees pipeline health, activity volume, and forecast in a single view instead of hunting through the reports library each time.
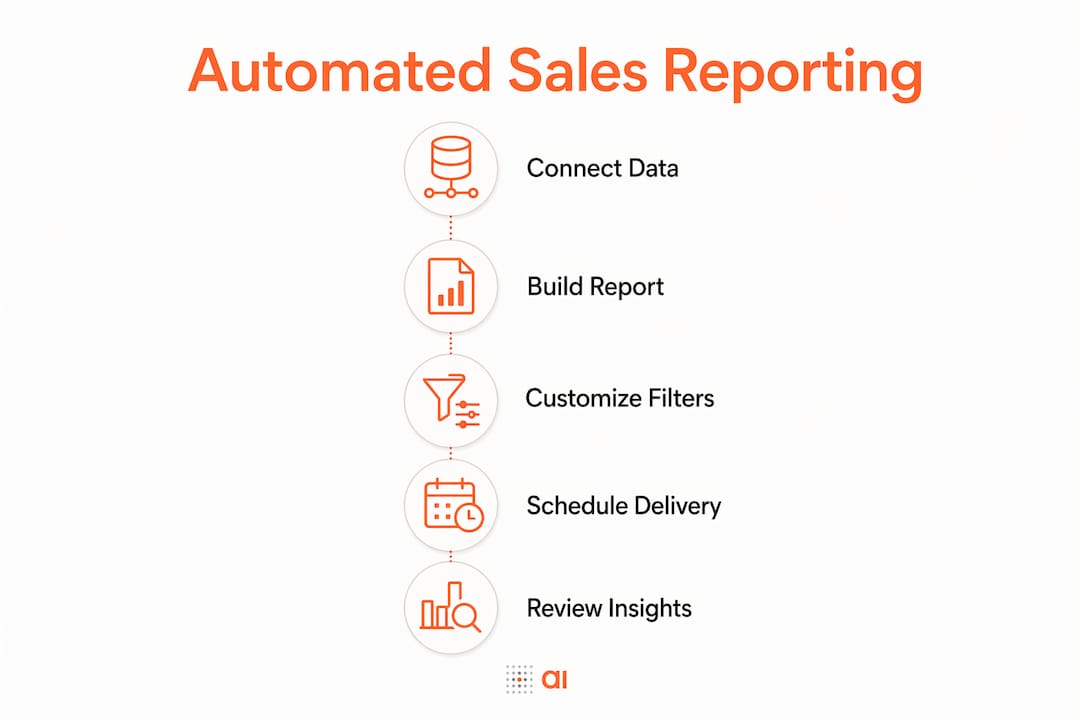
Reading the metrics that matter
A deal stage report only tells you something useful if you know what “stuck” looks like for your pipeline. Track time in stage alongside deal count. If a large cluster of deals sits in “Proposal Sent” for longer than your average sales cycle, that is a pipeline risk worth addressing in your next team call. Pairing sales dashboards from CRM data with your HubSpot reports gives you a fuller picture across the whole revenue process.
How to build custom sales reports in HubSpot’s Custom Report Builder
The Custom Report Builder is where HubSpot’s reporting gets genuinely powerful. You can pull from multiple data sources at once, combine object data with activity data, and build reports that the pre-built suite simply cannot produce.

Permissions you need first
To create or edit a custom report, your HubSpot user account must have Create/own and Edit report permissions. If you can view reports but the “Create report” button is grayed out, ask your HubSpot admin to update your permissions under Settings > Users and Teams.
Building a custom report step by step
- Go to Reporting > Reports and click Create report in the top right.
- In the left sidebar, click Custom report, then click Next.
- Select your Primary data source from the dropdown. Common choices for sales teams include Deals, Contacts, and Companies.
- Toggle Add more data sources on if your report needs to cross objects. For example, combining Deals with Email Activity lets you see how outreach volume correlates with close rate.
- Click + Add association labels if you need to filter by specific record relationships.
- Click Next to move into the report builder.
- Drag fields from the left panel into your report. Add the properties, events, or activity data you want to measure.
- Set your filters: date ranges, pipeline stages, deal owners, or any custom property your team tracks.
- Choose a visualization type: bar chart, line chart, area chart, pie chart, pivot table, or a combination view.
- Click Save report, name it, add tags, and choose whether to save it to an existing dashboard or create a new one.
- Set access permissions so the right people can view or edit the report.
Data refresh: automatic and manual
Custom reports refresh automatically every two hours. For most daily reporting needs, that cadence is more than enough. Before a pipeline review or an executive presentation, though, you want the freshest possible data. You can manually trigger a refresh once every 15 minutes. Just open the report, click the refresh icon, and HubSpot pulls the latest CRM data immediately.
Organizing reports into dashboards and folders
HubSpot lets you save reports to folders and dashboards for cleaner management. Create a folder structure that mirrors your team’s reporting rhythm: one folder for weekly pipeline reviews, another for monthly executive summaries, and a third for ad hoc analysis. Dashboards can be shared with specific users or teams, and you can set role-based permissions so a sales rep sees their own performance data while a manager sees the full team view.
Troubleshooting common issues
- Report shows no data: Check that your selected data sources and filters are not too narrow. A date range of “last 7 days” combined with a specific deal owner and a single pipeline stage can return zero results even when data exists.
- Fields are missing: Some properties only appear when the matching data source is added. If you cannot find a deal property, confirm that Deals is selected as a data source.
- Refresh not updating: Manual refresh is limited to once every 15 minutes. If you just refreshed, wait before trying again.
- Permissions error on save: You need both Create/own and Edit permissions. View-only access does not allow saving.
Pro Tip: Use Breeze AI to prototype a report fast. Type your question in plain English, review the generated template, then switch to the Custom Report Builder to refine the filters and visualization. It cuts setup time considerably for reports you have never built before.
Use cases worth building
- Rep performance by deal stage: Combine Deals and Contact owner data to see which reps advance deals fastest through each stage.
- Email activity vs. close rate: Cross Deals with Email Activity to find the outreach volume that correlates with won deals.
- Target account engagement: Merge Companies with Website Activity to track how your named accounts interact with your content before a deal is created.
- Forecast accuracy over time: Compare Forecast Amount at deal creation against Closed Amount to measure how accurate your team’s estimates are by quarter.
For teams whose reporting needs extend beyond HubSpot’s native CRM metrics, advanced multi-source analytics often benefit from integration with BI tools like Power BI or Databox.
How to automate sales report delivery and scheduling in HubSpot
Building a great report is only half the job. If your team has to remember to check it, they will not. Automated delivery solves that by pushing the right data to the right people on a schedule you set once and forget.

Setting up recurring email delivery
HubSpot lets you schedule recurring report emails on a daily, weekly, or monthly basis. You can set up multiple recurring schedules for a single report, which means your SDR team can get a daily activity summary while your VP gets a weekly pipeline digest from the same underlying report.
To schedule a report email:
- Open the report you want to schedule.
- Hover over Actions and select Email this report.
- Set Recurring email to yes.
- Name the email, add recipients, and choose the frequency, day, and time.
- Save the schedule.
For dashboards, the process is the same. Start from the Dashboard view, hover over the dashboard name, and select the email scheduling option.
Slack and Google Chat notifications
If your sales team lives in Slack, HubSpot’s Slack integration lets you send report alerts directly to a channel. You can configure notifications to fire when a deal stage changes, when a rep hits a threshold, or on a recurring schedule. Google Chat works the same way. This keeps pipeline visibility inside the tools your team already uses without requiring anyone to log into HubSpot to check a number.
The non-HubSpot user limitation
Recurring dashboard emails can only go to HubSpot users. If you need to send a report to an external stakeholder, a board member, or a partner who does not have a HubSpot seat, you have two options: send a one-off manual email (which works for non-HubSpot addresses when the domain is connected as an email sending domain), or export the report as a CSV or Excel file and send it separately. This is a real constraint for teams with external reporting requirements, and it is worth knowing before you build your distribution list.
Data governance: the step most teams skip
Automated reporting broadcasts whatever is in your CRM. If your deal stages are inconsistently named, if reps are skipping required fields, or if your pipeline has duplicate records, automation will surface those problems at scale and fast. Standardize your property definitions and sales stages before you set up recurring delivery. A clean data foundation is what separates a report your team trusts from one they quietly ignore.
Pro Tip: Pair your scheduled email delivery with a manual refresh triggered 10 minutes before the email sends. The automatic two-hour cycle may not align perfectly with your send time, so a manual refresh right before delivery means recipients always see the most current data.
Balancing automation with accuracy
Automation does not replace judgment. A weekly pipeline email tells your manager that deals exist. It does not tell them why three deals stalled in “Contract Sent” for three weeks. Use AI-assisted insights in HubSpot to surface anomalies and flag risks automatically, then add a brief written commentary when you share the report with leadership. That combination of automated data and human context is what turns a report into a decision.
For teams managing reporting across spreadsheets, CRM exports, and multiple tools, Gainable connects HubSpot directly to your existing data model and builds a live app around it, so your sales operations workflows run from one source instead of three.
When HubSpot’s native reporting reaches its limits
HubSpot’s reporting covers most of what a sales team needs. But there are scenarios where the native tools hit a ceiling: complex multi-source analytics that pull from outside the CRM, custom calculations that HubSpot’s field logic cannot express, or teams that need a live app rather than a scheduled email.
That is where Gainable fits. Gainable’s data connectors sync HubSpot with your spreadsheets, Stripe data, Airtable bases, and more, merging everything into a single record by a key you choose. The result is a working app with dashboards, audit logs, and live updates, built from the data you already have. Your team works in the app. Your spreadsheet stays current. The export-and-email loop disappears.
If your sales reporting has outgrown what a scheduled HubSpot email can deliver, Gainable’s operations apps give you a real interface built on your live CRM and spreadsheet data, without starting from scratch.
Key Takeaways
HubSpot’s Sales Analytics Suite and Custom Report Builder together cover the full range of automated sales reporting, from pre-built pipeline views to multi-object analytics with scheduled delivery.
| Point | Details |
|---|---|
| Start with Sales Analytics Suite | Pre-built Activity, Deals, and Forecast reports are ready to customize and save in minutes. |
| Use Breeze AI to prototype fast | Type a plain-language question and HubSpot generates a report template with filters and a visualization automatically. |
| Custom reports refresh every two hours | Trigger a manual refresh every 15 minutes when you need current data before a meeting or presentation. |
| Recurring emails go to HubSpot users only | External stakeholders require a one-off manual email or a CSV export sent separately. |
| Clean data before automating | Inconsistent deal stages and missing fields degrade report accuracy at scale; standardize properties first. |