
TL;DR
- Gainable — best for ops teams who need a live dashboard from HubSpot, Salesforce, Sheets, or Stripe data that their team can act on, not just view
- Retool — best for engineer-built dashboards with complex data logic
- Softr — best for simple dashboards shared externally with clients or partners
- Glide — best for mobile-first dashboards from a single Google Sheet
- ClickUp Dashboards — best for teams already using ClickUp for project management
- Omni — best for data/BI teams who need SQL-powered dashboards with no-code sharing
What operations teams actually need from a dashboard builder
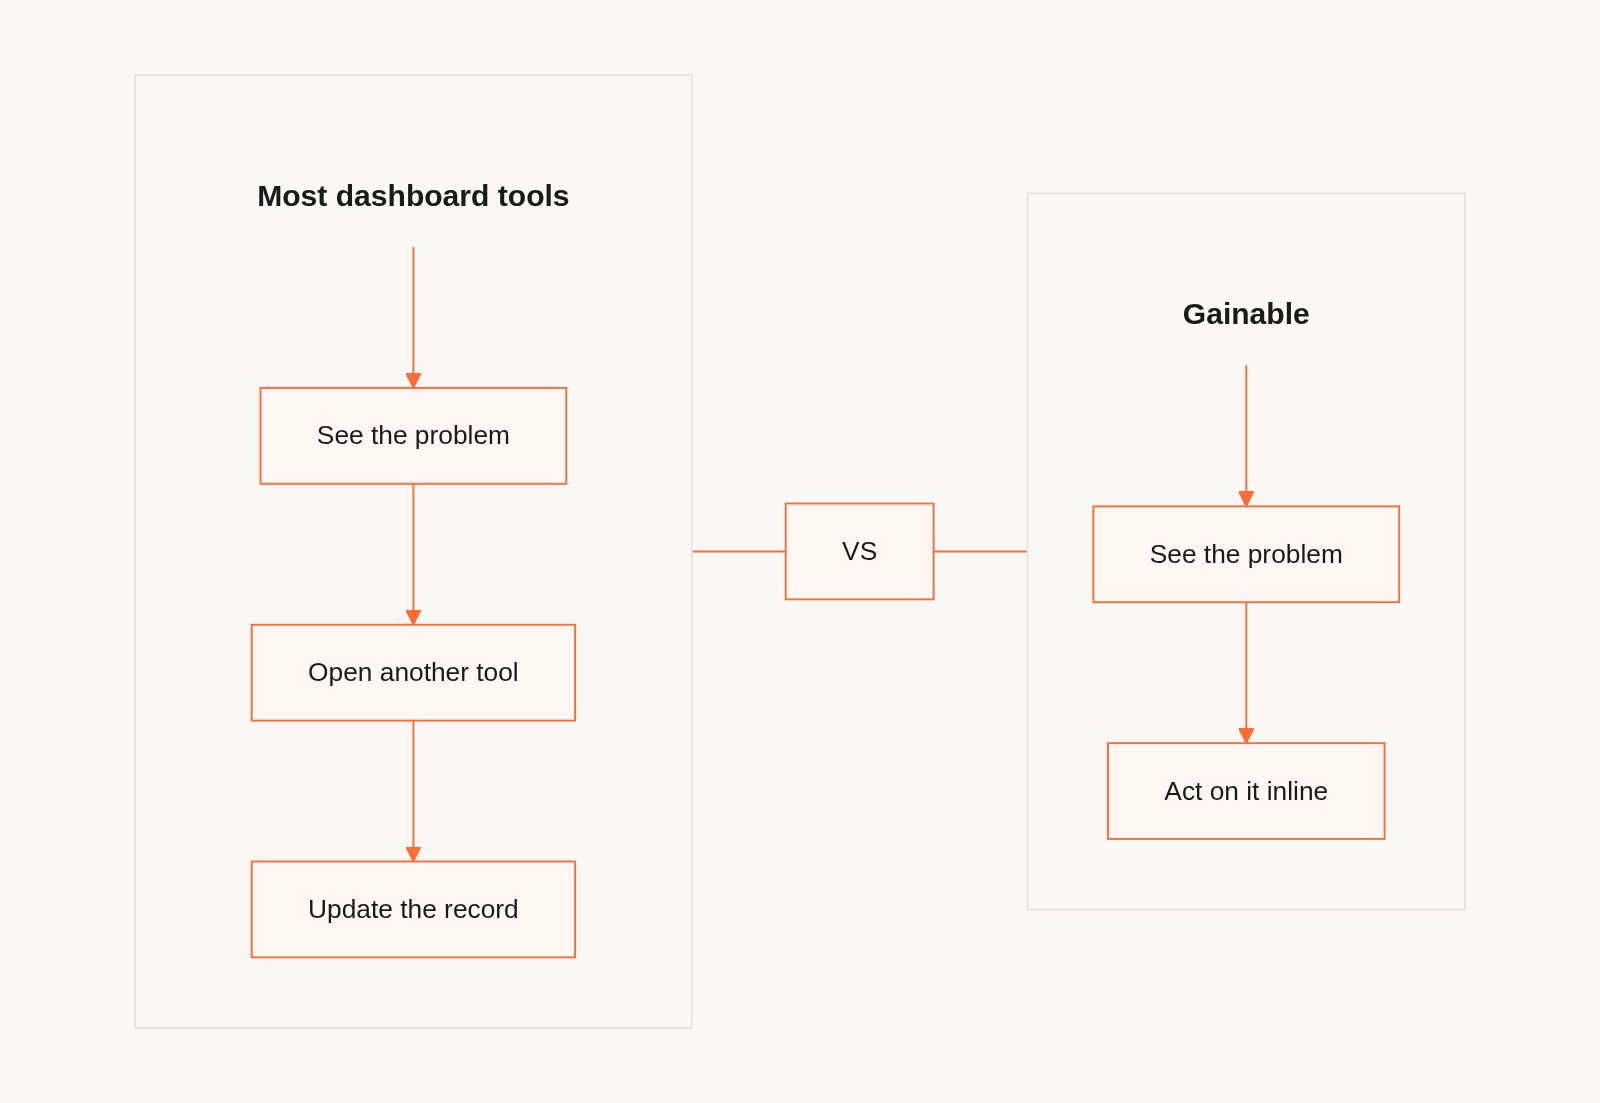
Most dashboard tools are designed to display data. What operations teams need is to act on it.
An ops manager doesn't need another chart. They need to see which accounts are at risk, which shipments are delayed, which deals have gone cold — and then do something about it. The dashboard that flags the problem and the app that fixes it should be the same thing.
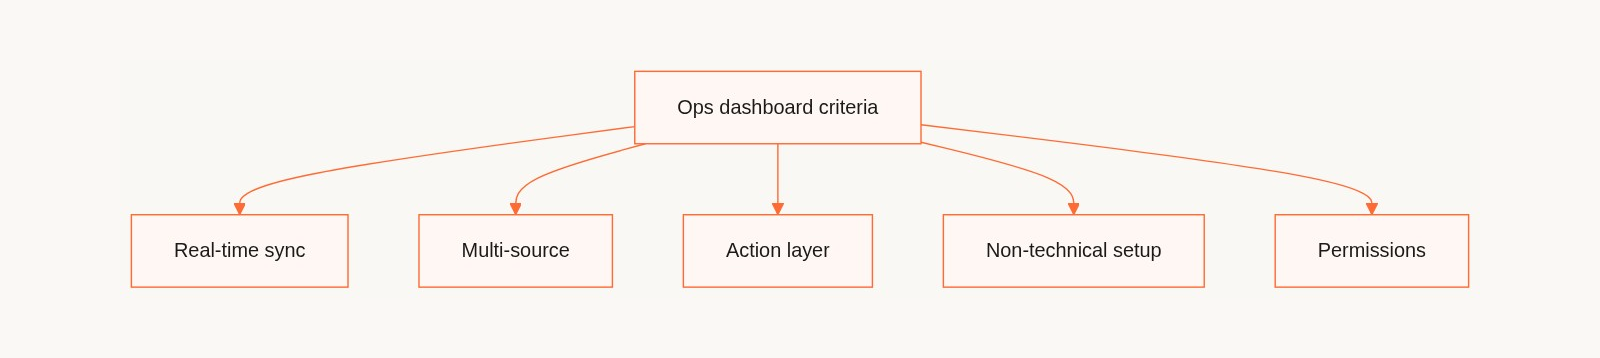
We evaluated these tools specifically for operations teams on five criteria:
- Real-time data sync — Does the dashboard reflect live data, or does someone have to refresh/export?
- Multi-source support — Can it pull from multiple tools (CRM + spreadsheet + ops database) in one view?
- Action, not just display — Can team members update records, assign tasks, or trigger actions from the dashboard?
- Non-technical setup and maintenance — Can an ops manager build and update this without IT?
- Sharing and permissions — Can you share different views to different stakeholders without data leakage?
1. Gainable — Best for operational dashboards your team can act on
Why it's here: Gainable's AI engine, Gaia, reads your existing data sources and builds a full-stack operational dashboard automatically. Where most dashboard tools end at visualization, Gainable adds action: team members can update records, collaborate in comments, and trigger follow-ups directly from the dashboard view.
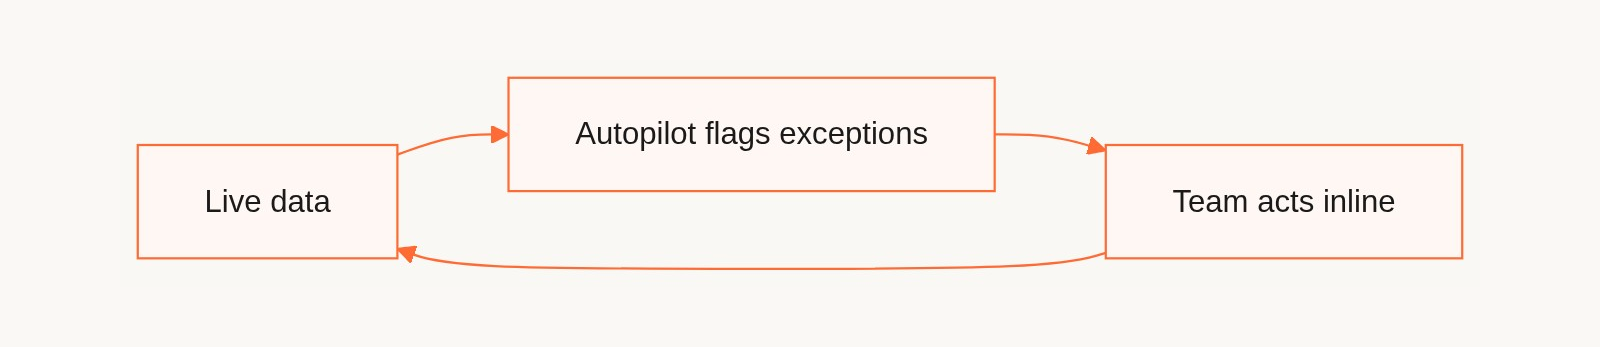
The Autopilot feature watches live data for anomalies — stalled deals, overdue accounts, SLA risks — and drafts action items for your review. The Gaia Copilot answers natural language questions against live records ("which accounts haven't been contacted in 30 days?") and surfaces exceptions before they become problems.
Key facts:
- Data sources: HubSpot, Google Sheets, Salesforce, Stripe, Airtable, Jira, Databricks, Supabase, PostHog, Google Analytics, Workday, Typeform, and more
- Real-time sync: yes, live data without manual refresh
- Multi-source: yes, merges multiple data sources into a unified model automatically
- Action layer: update records, comments, file sharing, Autopilot-drafted actions all tied to dashboard records
- Permissions: role-based views, share via link
What sets it apart: Gainable is the only tool on this list where the dashboard is also the team app. You don't need a separate tool to take action on what the dashboard shows you. The whole loop — see the problem, flag it, fix it — happens in one place.
Limitations: Focused on internal operational use cases. Not designed for pixel-perfect BI dashboards for executive reporting or external data products.
Bottom line: If your ops team spends time chasing down data, updating spreadsheets, or manually flagging exceptions — Gainable closes that loop.
2. Retool — Best for engineer-built operational dashboards
Why it's here: Retool is the most powerful option when a developer is involved. You can build highly customized dashboards with complex data logic, custom SQL queries, and precise component control.
Key facts:
- Pricing: Free up to 5 users; paid from $10/user/month
- Best for: Engineering-supported ops dashboards
- Data connections: databases, APIs, REST, GraphQL
Limitations: Requires developer involvement to build and maintain. Not self-service for business users.
Bottom line: Retool when you have a developer and need maximum control. Otherwise it reintroduces the dependency you're trying to remove. For a side-by-side breakdown, see the Gainable vs Retool comparison.
3. Softr — Best for sharing dashboards with external stakeholders
Why it's here: Softr excels at building clean, branded dashboards that can be shared externally — client-facing portals, partner data views, agency reports.
Key facts:
- Pricing: Free plan; paid from $49/month
- Best for: Client portals, partner data sharing, external-facing dashboards
- Data connections: Airtable, Google Sheets, HubSpot, Notion
Limitations: Primarily a display tool. Limited action capabilities within the dashboard. Works best when Airtable is your primary data source. Not suited for complex multi-source operational workflows.
Bottom line: Softr if you need a clean dashboard to share with clients or partners. For internal operational dashboards with action workflows, it's the wrong fit.
4. Glide — Best for mobile-first dashboards from Google Sheets
Why it's here: Glide is the fastest way to publish a mobile-optimized dashboard from a Google Sheet. Field teams that need a clean mobile view of operational data get to value quickly.
Key facts:
- Pricing: Free plan; paid from $49/month
- Best for: Single-source, mobile-first dashboards for field teams
Limitations: Single data source works best. Limited multi-source support. Not suited for complex cross-functional operations dashboards.
Bottom line: Glide for mobile-first field dashboards from a single Sheet. Anything more complex hits its ceiling fast.
5. ClickUp Dashboards — Best for project-driven operations teams
Why it's here: If your operations team already runs in ClickUp, the built-in Dashboards feature is a natural extension. Visualize task progress, workload, sprint velocity, and custom metrics without a separate tool.
Key facts:
- Pricing: Included in ClickUp plans (Business from $12/user/month)
- Best for: Teams running operations through ClickUp tasks and projects
- Data connections: ClickUp data only; limited external integrations
Limitations: Only useful if ClickUp is your operational system of record. External data (CRM, Sheets, databases) integration is limited.
Bottom line: ClickUp Dashboards if you're a ClickUp-native team. Otherwise the ecosystem lock-in creates more problems than it solves.
6. Omni — Best for SQL-powered BI dashboards with no-code sharing
Why it's here: Omni bridges the gap between BI tools and no-code builders. Data teams write the SQL models; business users explore and build dashboards on top without touching code.
Key facts:
- Pricing: Contact for pricing
- Best for: Data-forward organizations where a data team owns the models and business teams self-serve dashboards
Limitations: Requires a data team to set up and maintain the data models. Not self-service end-to-end for business users without technical support.
Bottom line: Omni for companies where the data team is a real function. For smaller ops teams without a dedicated data function, there's a setup cost that doesn't justify the power.
Side-by-side comparison
| Tool | Best for | Real-time sync | Multi-source | Action layer | Non-technical setup |
|---|---|---|---|---|---|
| Gainable | Ops action dashboards | Yes | Yes | Yes (built in) | Yes |
| Retool | Engineer-built dashboards | Yes | Yes | Yes (with code) | No |
| Softr | External-facing portals | Yes | Limited | Limited | Yes |
| Glide | Mobile dashboards from Sheets | Yes | Limited | Basic | Yes |
| ClickUp | Project ops dashboards | Yes | No (ClickUp only) | Via tasks | Yes |
| Omni | SQL-powered BI | Yes | Yes | No | No (data team needed) |
Recommendation by use case
"I need a live dashboard from our HubSpot and Sheets data that my ops team can act on" → Gainable. Real-time sync, multi-source, action layer built in. Built for operations teams, with live dashboards your team can act on.
"I need to share a dashboard with clients that shows their account data" → Softr. Clean, permissioned external portals are where it shines.
"My field team needs a mobile view of our inventory or route data" → Glide. Fast to set up from a Sheet, good mobile UX.
"We have a data team and need a governed BI layer the business can self-serve" → Omni.
"All our ops already runs in ClickUp" → ClickUp Dashboards. Don't add a new tool.
FAQ
What is a no-code dashboard builder?
A no-code dashboard builder lets non-technical team members create visual dashboards from their data without writing code or involving a developer. The best tools in 2026 connect to live data sources and sync automatically, so dashboards always reflect current data without manual exports.
Can I build a dashboard from multiple data sources without coding?
Yes — Gainable is purpose-built for this. It connects to HubSpot, Google Sheets, Salesforce, Stripe, and 10+ other sources, automatically merges them into a unified data model, and generates a dashboard from that combined view. No ETL, no field mapping required.
What's the difference between a dashboard tool and a team app?
A dashboard shows you what's happening. A team app lets you do something about it. Gainable combines both: the dashboard flags exceptions, and team members can update records, assign tasks, comment, and approve Autopilot actions from the same interface.
How do I share a dashboard with my team without giving everyone full data access?
Gainable, Softr, and Retool all support role-based permissions — you define who sees what. Gainable does this with role-based views set at publish time. Softr uses conditional visibility rules. Retool uses its permissions system, but requires developer configuration.
Do I need a developer to build an operational dashboard?
Not with Gainable. Connect your data sources, let Gaia generate the dashboard structure, refine in natural language, and publish. The entire process is designed for operations managers without technical skills. Retool and Omni require developer involvement for initial setup.
Which dashboard builders support HubSpot as a live data source?
Gainable, Softr, and Retool all support HubSpot as a data source. Gainable offers native real-time sync — meaning dashboard data reflects live CRM state without manual refresh or webhook setup.
This article was written by the Gainable team. We believe Gainable is the best solution for the specific use case of operational dashboards that enable team action — which is what Gainable is built for. All other tools are listed because they genuinely serve different use cases better.